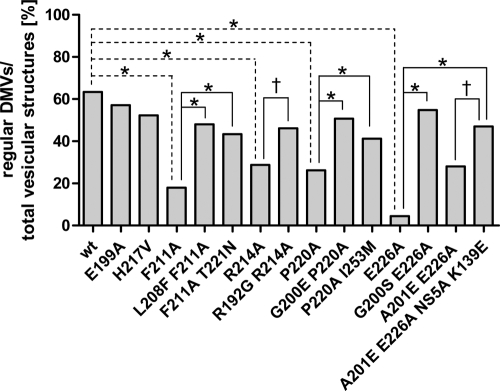
Fig. 9.
Quantitative analysis of DMV morphotypes. At least 100 vesicular structures per sample from at least three different cells were counted. For each construct the ratio of regular DMVs per total HCV-induced vesicular structures (regular DMVs, aberrant DMVs, and MMVs) is given. The significance of the differences was calculated by using the two-sided Fisher's exact test and is highlighted for the wt and the primary mutants (dashed lines) or the primary mutant and corresponding pseudorevertants (black lines) (*, P < 0.0001; †, P < 0.01).

