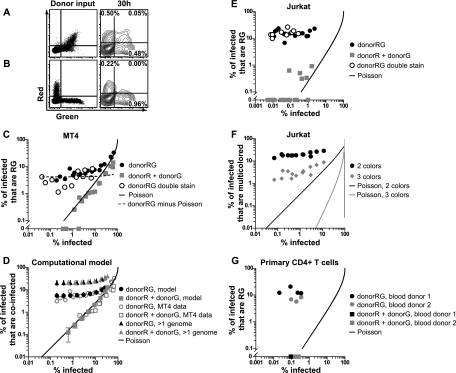
Fig. 3.
The cofluorescence frequency of cell-to-cell infection is proportional to the overall infection frequency and does not follow a Poisson distribution. (A) Cell-to-cell infection with Jurkat donor cells coexpressing red and green fluorescent HIV, i.e., Jurkat donorRG and MT4 target cells. Flow cytometry dot plots of donor input (left) and log contour plots of target cells after 30 h (right) are shown. (B) Cell-to-cell infection with a mixture of donor cells expressing HIV(Red) or HIV(Green), i.e., Jurkat donorR, Jurkat donorG, and MT4 target cells. Flow cytometry dot plots of donor input (left) and log contour plots of target cells after 30 h (right) are shown. (C) Titration of Jurkat donor cells onto MT4 target cells. Graphs show percentages of infected MT4 target cells that are red and green (RG) (y axis) versus the overall infection frequency (x axis) following infection with cells coexpressing red and green virus, donorRG cells, or separately expressing red or green virus, i.e., donorR and donorG cells. DonorRG double stain indicates experiments where donorRG cells were additionally discriminated from target cells by using a second CellTracker dye. Poisson line indicates the expected curve if coinfection follows a Poisson distribution. DonorRG minus Poisson indicates subtraction of the expected Poisson distribution from the donorRG data points. (D) Computer simulation of infections of Jurkat donor cells and MT4 target cells to estimate the percentage of target cells that carry more than one genome. Plot of average percentages of infected MT4 cells that are coinfected versus the overall infection frequency (see Materials and Methods for details and parameters). Plots are shown with computer simulation data next to actual MT4 data. When provided with donor cell cofluorescence information, the model accurately outputs target cell cofluorescence values for the donorRG experiment and the donorR + donorG experiment and predicts that the percentages of infected cells that have more than one genome will be similar for both donorRG and donor plus donorG experiments. Error bars show standard deviations. (E) Titration of Jurkat donor cells onto Jurkat target cells. (F) Titration of Jurkat donorRGB cells and Jurkat target cells. A graph of the percentage of infected Jurkat target cells expressing only two different fluorescent proteins or all three different fluorescent proteins versus the overall infection frequency is shown. (G) Titration of infected primary CD4+ T cells onto primary CD4+ T cell targets. Shown is a graph of the percentage of infected primary CD4+ T cells that are RG (y axis) versus the overall infection frequency (x axis) after infection with donorRG or donorR + donorG cells for two different donors. Abbreviations: R, HIV(Red); G, HIV(Green); B, HIV(Blue).

