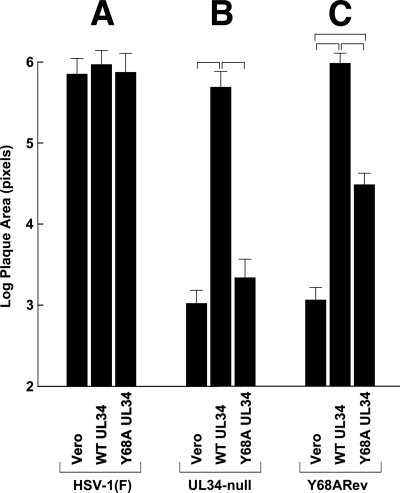
Fig. 3.
Quantitation of plaque formation on wild-type and mutant UL34-expressing cell lines. Histograms of mean plaque sizes on Vero, WT pUL34-expressing, and Y68A pUL34-expressing cells are shown. Plaques stained 2 days after infection, as described in the legend to Fig. 2, were photographed, and plaque areas in image pixels were determined using ImageJ. For each bar, 20 randomly selected plaques from two independent experiments (40 plaques total) were measured. Brackets indicate pairwise statistical comparisons performed using a Student t test. All of the indicated comparisons showed a highly significant difference (P < 0.001). Note that the y axis has a logarithmic scale.

