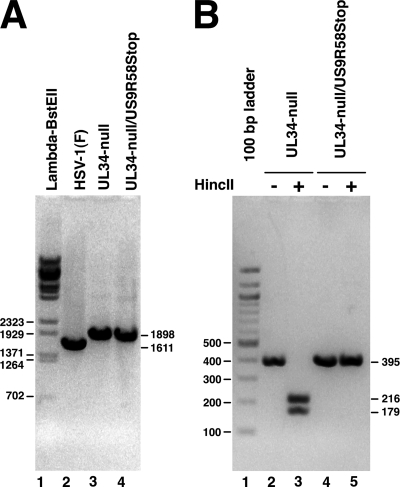
Fig. 8.
Characterization of mutation at the UL34 and US9 loci. Digital images show electrophoretically separated PCR products. (A) Amplification products from the UL34 locus using genomes from rescued viruses as the template. The BAC used for rescue is indicated above each lane. The sizes of the PCR products are indicated to the right of the gel. Lambda BstEII digest size standards are shown in lane 1, and the sizes of standard bands are indicated to the left of the gel. (B) Amplification products from the US9 locus that are either undigested (lanes 2 and 4) or digested with restriction enzymes HincII (lanes 3 and 5). A 100-bp ladder is shown in lane 1.

