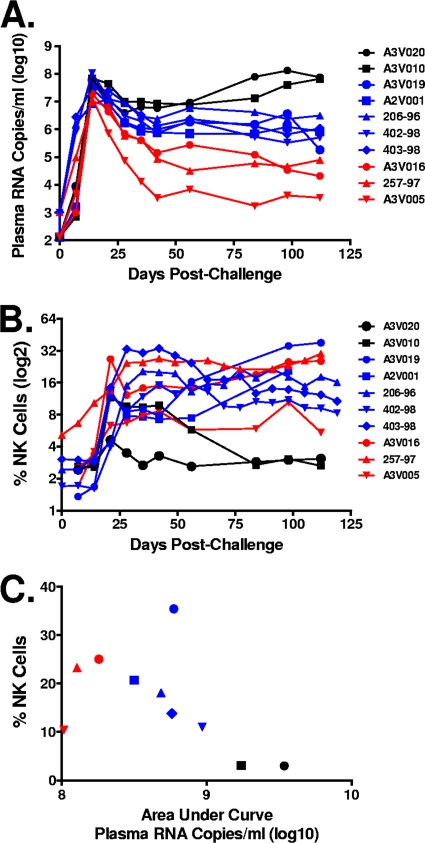
Fig. 3.
Correlation between the magnitudes of the NK cell-mediated ADCC responses and the plasma viral RNA levels. Six Mamu-A*01− and 4 Mamu-A*01+ rhesus monkeys were infected with SIVmac251 by the intravenous route and followed for 120 days. (A) Dynamics of plasma viral RNA levels following SIVmac251 infection. (B) Purified human NK cells were incubated with SIVmac251 gp130-coated CEM-NKr-CCR5 target cells and a 1:200 dilution of plasma sampled from these rhesus monkeys at the indicated time points following SIVmac251 infection. Data are expressed as percentages of CD3− CD20− CD56+ NK cells expressing CD107a. (C) The dot plot shows the relationship between the ADCC responses at 100 days after SIVmac251 infection and the AUC of viral RNA levels through day 100 after this virus infection for each monkey.

