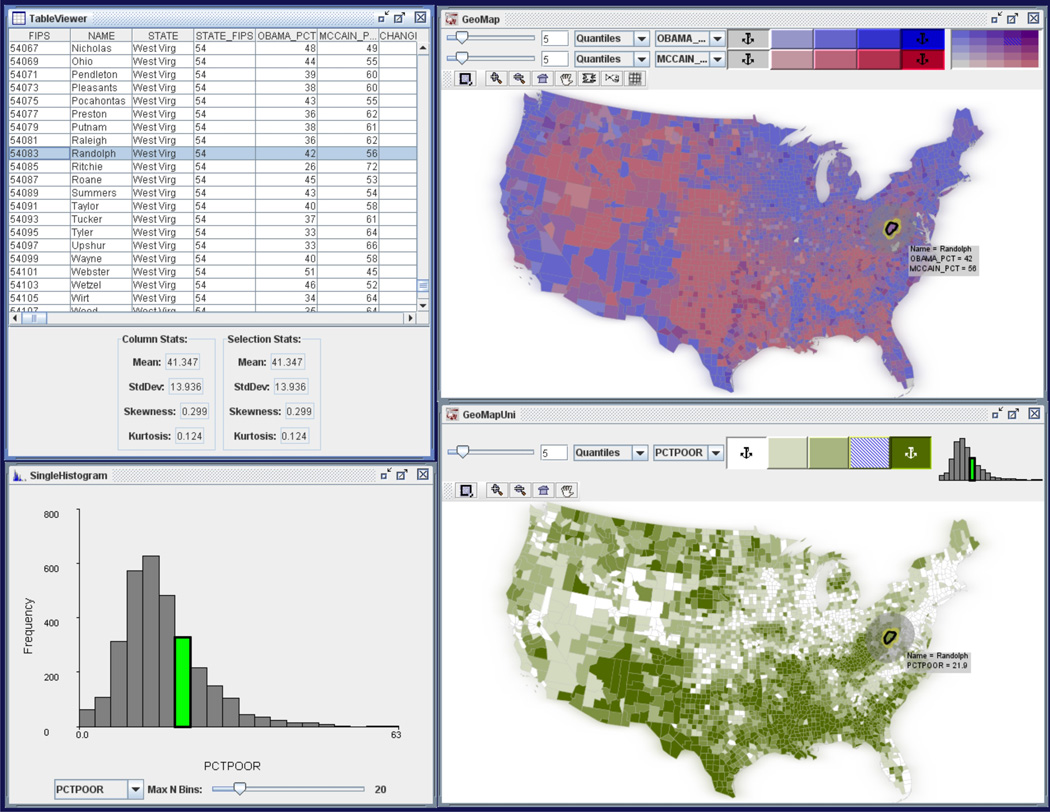
Figure 5.
The GVT has been reconfigured on-the-fly to remove the parallel coordinate plot and scatterplot, and add a table viewer, histogram tool, and univariate map. The table viewer shows the entire raw dataset. The histogram and univariate map are showing different representations of the percent of people currently living under the poverty line. Randolph County, West Virginia is highlighted in each of the views. It has a high percentage of impoverished residents and McCain won by 14 points.

