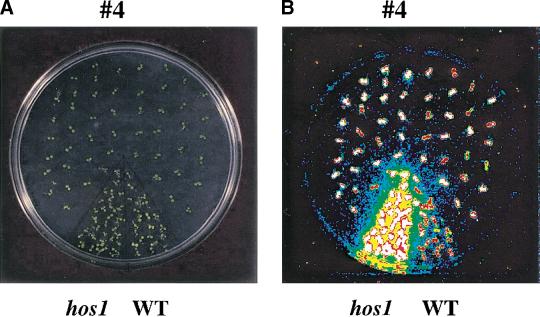
Figure 10.
Ectopic expression of HOS1 causes silencing of HOS1 expression and mimics the hos1 mutant phenotypes. Ten-day-old wild-type seedlings (WT), hos1, and T2 progenies of a wild-type plant containing the 35S–HOS1 construct (designated as line #4) were incubated at 0°C for 24 h before the bioluminescence image was taken. (A) Picture of wild-type, hos1, and T2 progenies of transgenic line #4. (B) Bioluminescence image of plants in A. (C) Quantification of the luminescence intensities in B. Shown are the averages and standard deviations (n = 15). T2 progenies of the #4 line were segregated into two groups, which are designated #4-high and #4-low, corresponding to those exhibiting high expression and low expression of RD29A–LUC, respectively. (D) Reduced HOS1 transcript abundance in the #4 cosuppression plants, as determined by quantitative RT–PCR.


