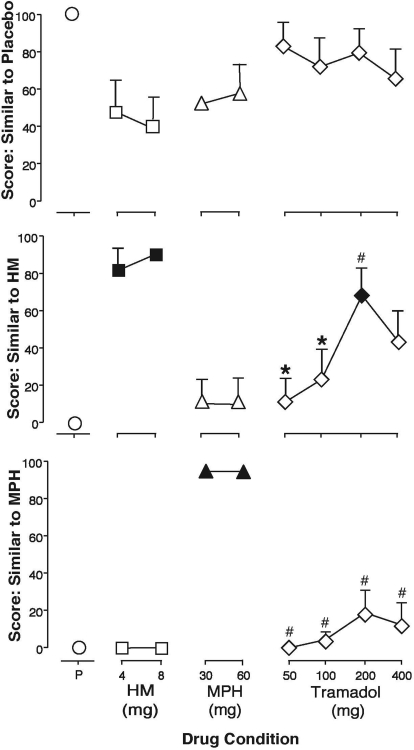
Fig. 2.
Volunteers were asked to rate how similar each test drug condition was to each drug, as identified by letter code. Data represent mean peak change from baseline (+S.E.M.) for visual analog scale scores for similar to placebo (top), similar to HM (middle), and similar to MPH (bottom). Closed symbols indicate a significant difference from placebo. *, p < 0.05 versus hydromorphone (4 and 8 mg); #, p < 0.05 versus methylphenidate (30 and 60 mg).

