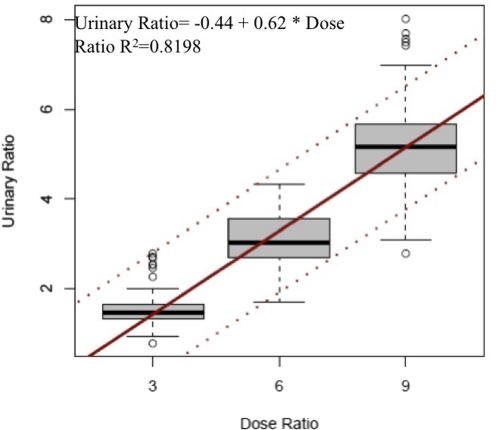
Fig. 4.
Relationships between urine [d-MA-d0]:[l-MA-d3] and d-MA-d0/l-MA-d3 dose ratio. The line within the box is the median, the area within the box contains the second and third quartiles, and whiskers include data points that fall within 1.5 times the interquartile range. The solid black line is the regression line. Dashed lines are 95% prediction bands.

