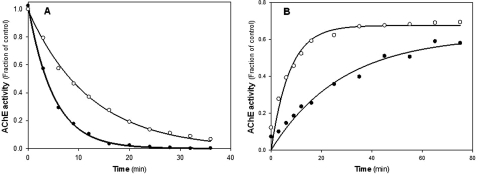
Fig. 6.
Time course of alkyl phosphate inhibition of wild-type (●) and D134H (○) hAChE activity by exposure to 1.0 μM paraoxon (A) and reactivation by 1.0 mM 2-PAM (B). Curves were generated by nonlinear regression as described previously (Kovarik et al., 2003, 2004).

