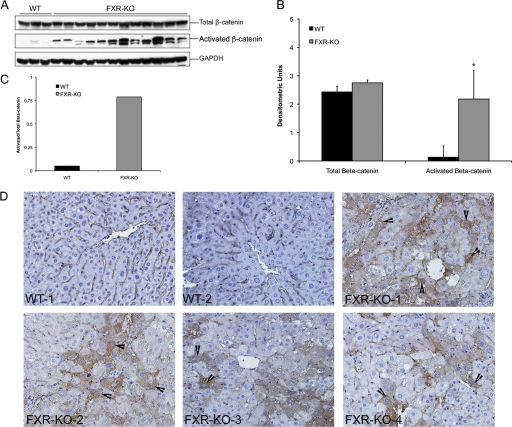
Fig. 1.
Increased activation of β-catenin in the livers of FXR-KO mice. A, Western blot analysis for total and activated (dephosphorylated) β-catenin using total liver extracts from WT and FXR-KO mice. B, densitometric analysis of total and activated β-catenin Western blots from liver homogenates from WT and FXR-KO mice in A. Data are expressed as mean ± S.D. Statistical significance: *, P < 0.05. C, bar graph showing the ratio of activated to total β-catenin in the livers of WT and FXR-KO mice. D, representative photomicrographs of total β-catenin immunohistochemistry in the livers of WT and FXR-KO mice. Representative photographs of the livers of two WT and four independent FXR-KO mice are shown. Arrowheads point to cytoplasmic and nuclear stabilization of β-catenin. Magnification, 400×.

