Fig. 5.
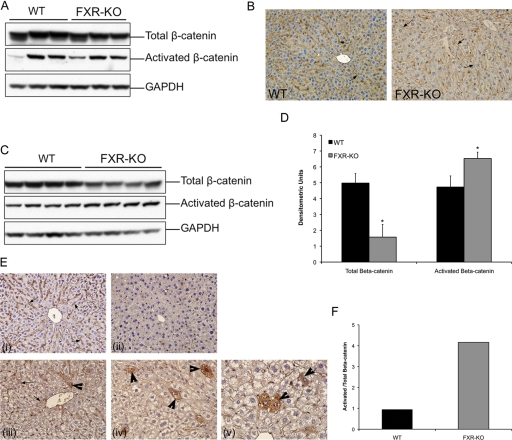
Temporal increase in β-catenin activation in the livers of FXR-KO mice. A, Western blot analysis of total and activated β-catenin in the livers of 3-month-old WT and FXR-KO mice. B, representative photomicrographs of β-catenin immunohistochemistry in the livers of 3-month-old WT and FXR-KO mice. Arrows indicate membranous β-catenin staining. C, Western blot analysis of total and activated β-catenin in the livers of 8-month-old WT and FXR-KO mice. D, densitometry of blots in C. Data are expressed as mean ± S.D. Statistical significance: *, P < 0.05. E, representative photomicrographs of immunohistochemical staining for total β-catenin (i) and activated β-catenin (ii) in WT mice and total β-catenin (iii) and activated β-catenin (iv) in FXR-KO mice. A high-magnification (600×) photomicrograph of activated β-catenin immunohistochemistry in the livers of FXR-KO mice at 8 months of age (v). F, bar graph showing the ratio of activated to total β-catenin in the livers of 8-month-old WT and FXR-KO mice.

