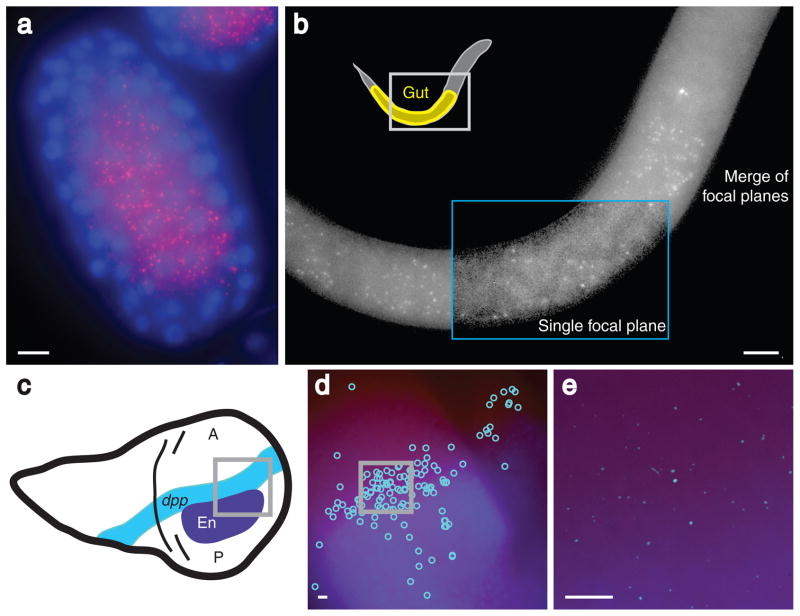
Figure 3.
Imaging localized mRNAs in C. elegans and D. melanogaster. a) elt-2 mRNA molecules (red) in an early stage embryo (~100 cell stage) from C. elegans; the nuclei have been counterstained with DAPI (blue). b) elt-2 mRNA molecules in an L1 larva from C. elegans. Inside the blue box, a single focal plane is shown in which the intestinal track is visible. c) A schematic depiction of dpp and engrailed expression in the imaginal wing discs of third instar larvae from D. melanogaster. d) Image showing the locations of the computationally identified dpp mRNA molecules (light blue circles) and Engrailed expression detected by immunofluorescence (dark blue). e) Image containing enhanced dpp mRNA molecule signals (light blue) and Engrailed protein expression detected by immunofluorescence (dark blue). All images except the boxed portion of (b) are maximum merges of a z-stack of fluorescent images, and all scale bars are 5 μm long.

