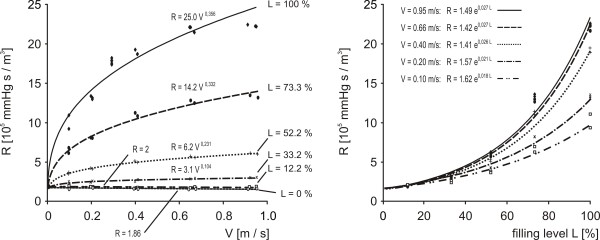
Figure 7.
Calibration curves describing the hydrodynamic behaviour of the clot carrier. The hydrodynamic resistance of the clot carrier (R) is shown as a function of the flow velocity of the streaming blood substitute (V) and the filling level of the clot carrier (L). For each measurement the experimental setup was completely reassembled to assure totally independent experiments.

