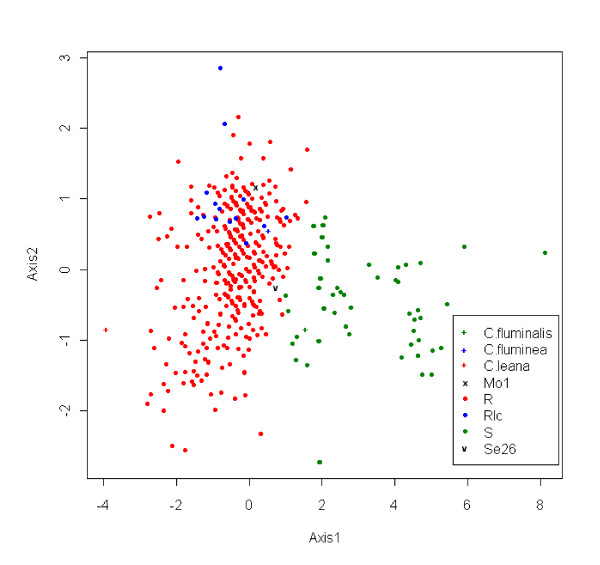
Figure 1.
Relationship between scores on Axis 1 and Axis 2 for the Principal Components Analysis for shell measurements on 429 specimens of Corbicula. R in red, Rlc in blue and S in green represent individuals of forms R, Rlc and S respectively. The type specimens of C. fluminalis, C. fluminea and C. leana are represented by symbols. Mo1 and Se26 are the two individuals exhibiting a mitochondrial-morphotype mismatch.

