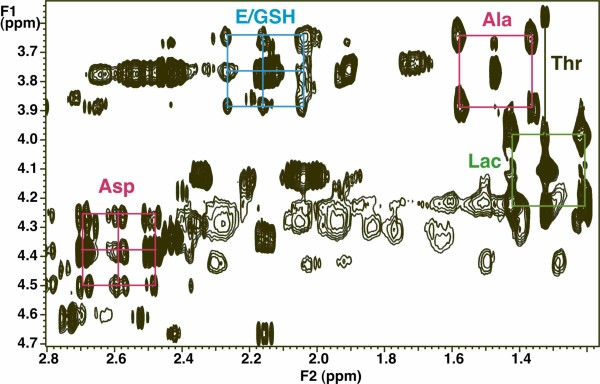
Figure 3.
13C Labeling in metabolites that report on glycolysis, Krebs cycle and uracil biosynthesis. The two-dimensional 1H total correlation spectroscopy (TOCSY) spectrum was recorded at 18.8 T using an isotropic mixing time of 50 ms at a B1 field strength of 8 kHz. The 13C satellites of glutamate and glutamate in reduced glutathione C2H-C4H are shown in cyan. This pattern corresponds to a mixture of species, namely where both 13C atoms are labeled in the same molecule plus 13C212C4 and 12C213C4. In contrast, the patterns for Ala (red) and Lac (green) shows only the 13C313C2 plus 12C312C2 pattern. Aspartate (red) shows a similar pattern as glutamate, reflecting scrambling through the Krebs cycle [8,10,11], and is the same as in U in UTP.

