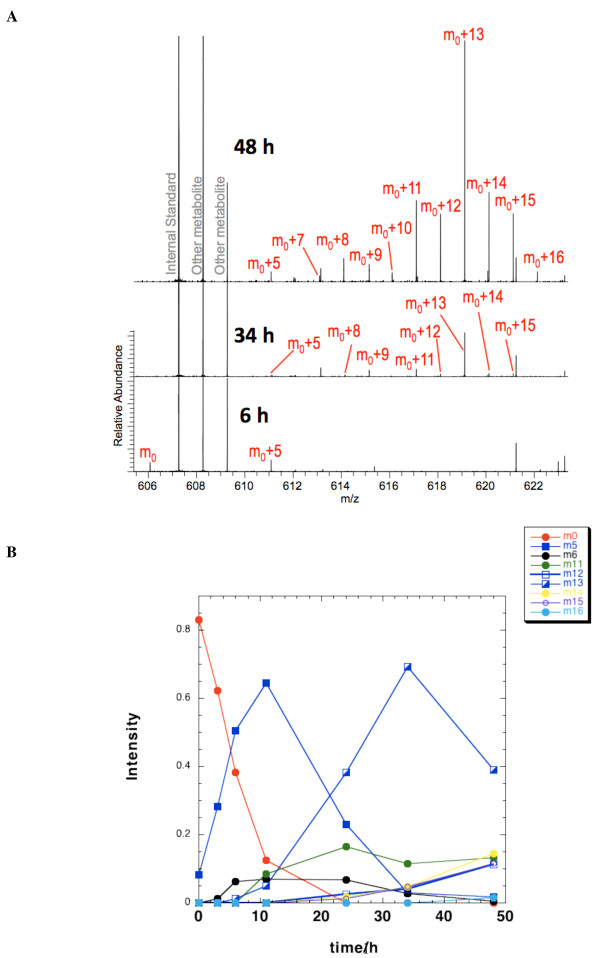
Figure 6.
Timecourse changes of UDP-N-acetyl-D-glucosamine (UDP-GlcNAc) isotopologues in LN3 extracts as determined by Fourier transform-ion cyclotron resonance-mass spectrometry (FT-ICR-MS). (a) FT-ICR-MS spectra at 6, 34 and 48 h post [U-13C]-glucose labeling. The spectra are plotted by normalization to cellular concentrations for direct comparison. For clarity, only the isotopologues visible at this scale are tagged; it should be noted that by 34 h the monoisotopic UDP-GlcNAc (m0) was barely detectable (data not shown). As is evident from this figure, different isotopologues increased in intensity at different rates, resulting in changing isotopologue distributions. M0+5, 7-16 correspond to the UDP-GlcNAc isotopologues with 5 and 7 to 16 13C atoms, respectively. (b) Timecourses of intensity of selected mass isotopologues. The normalized intensities were obtained as described in the Methods section. Only mass isotopologues that reached a significant level are plotted. Symbols are defined in the figure. The lines only serve to connect the data points. M0, 5,6, 11-16 represent monoisotopic UDP-GlcNAc and isotopologues with 5, 6 and 11 to 16 13C atoms, respectively.

