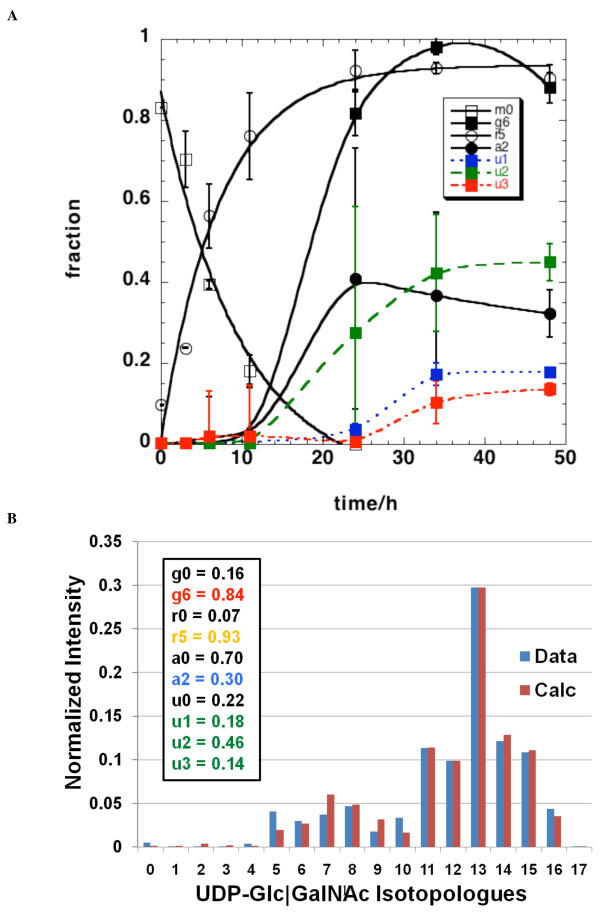
Figure 7.
Deconvolution of isotopologues of UDP-N-acetyl-D-glucosamine (UDP-GlcNAc) and kinetic modeling of their timecourses. Mass isotopologues at each timepoint were deconvoluted into individual isotopomer components and their intensity was corrected for natural abundance contribution, as described in the Methods section. (a) Mole fractions of the various components are plotted with time. m0 (open square), 13C6-glucose g6 (black filled square),13C5-ribose r5 (open circle), 13C2-acetyl a2 (black filled circle), 13C1-uracil u1 (blue filled square),13C2-uracil u2 (green filled square), 13C3-uracil u3 (red filled square). The ribose component was fitted to the function b(1-exp-kt) with b = 0.89 and k = 0.13 h-1 R2 = 0.977. The unlabeled species (m0) was fitted to a single exponential decay I(t) = I(0)exp(-kt) with I(0) = 0.88 ± 0.06, k = 0.13 ± 0.02 h-1 R2 = 0.967. (b) Reconstruction of the isotopologue distribution from the mole fraction probabilities in A for the 48 h timepoint. The best fit values for the fractions were obtained according to equations 3,4 and 5 using the 'Genetic Algorithm for Isotopologues in Metabolic Systems' (GAIMS) as described in the text. The symbols are given on the figure. Blue bars are the observed intensities at each m/z and red bars are the reconstructed intensities.

