
Figure 5.
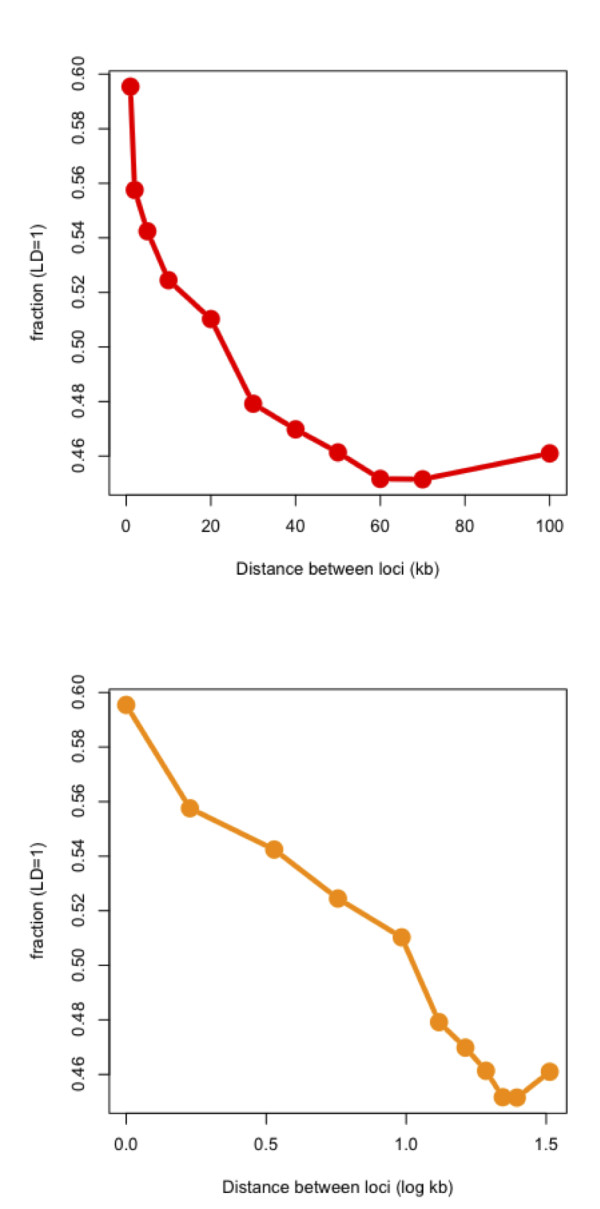
Illustration of distance-dependent decay in C. trachomatis core genome. A) For pairs of loci separated by increasing genetic distance on a linear scale, the proportion of pairs in full linkage (number of pairs with DA' = 1 ÷ total number of pairs in that distance bin) is plotted on the y-axis. B) The same plot as in figure 5(A) but the distance between loci is shown on a log scale (log kb).