
Figure 5. Correlation between gamma and beta power.
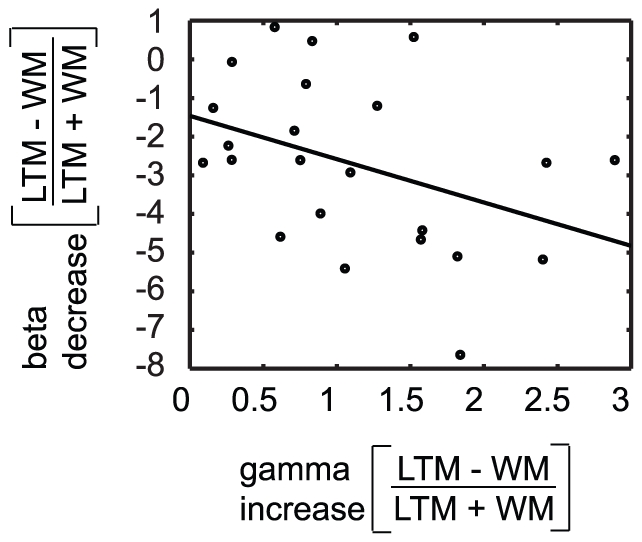
Correlation between modulations of gamma and beta power at the sensors where the significant effects were found, over subjects (N = 23). A negative correlation was found between gamma and beta power modulations (r = −0.48, p = 0.022).