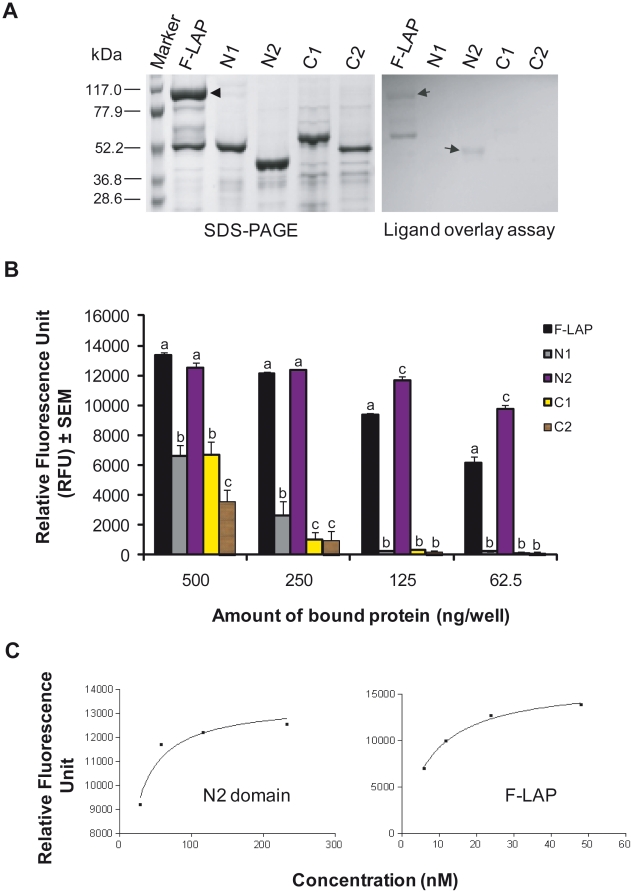
Figure 2. Analysis of LAP subdomain interaction with Hsp60.
(A; left panel) SDS-PAGE (7.5% acrylamide) gel showing affinity-purified LAP subdomains. All purified proteins showed expected band size of approximately 45–54 kDa, which includes LAP subdomains; N1 (24 kDa), N2 (21 kDa), C1 (28 kDa) and C2 (26 kDa) and endogenous His, S and Trx tags derived from pET-32a cloning vector (Novagen). (A, right panel) represents ligand overlay assay showing purified Hsp60 binding to the N2 subdomain (arrow). As a positive control, full length LAP (F-LAP) also reacted with Hsp60 but showing two bands, second 53 kDa band is thought to be a breakdown product. (B) Immunofluorescence assay of LAP subdomains (N1, N2, C1, and C2) and full-length LAP (F-LAP) interaction with Hsp60. Of the 4 varying concentrations tested, the N2 subdomain showed significantly higher Hsp60 interaction (P<0.05) relative to other LAP subdomains. Values labeled with different letters (a, b, c) for a given protein concentration are significantly different at P<0.05.(C) Interaction of N2 and F-LAP with Hsp60 using values from 2B above. A logarithmic fitting curve was observed when values for each subdomain were plotted against their respective concentrations. An R2 value of greater than 0.9 was used for curve fitting. Binding affinity (K D) values for N2 and F-LAP interactions with Hsp60 were calculated using the 1-site binding equation in Graphpad. K D values are the average of 2 independent curve-fitting experiments and were estimated to be 9.51±2.59 nM and 7.17±0.53 nM for N2 and F-LAP, respectively (average ± standard error of the mean [SEM]).

