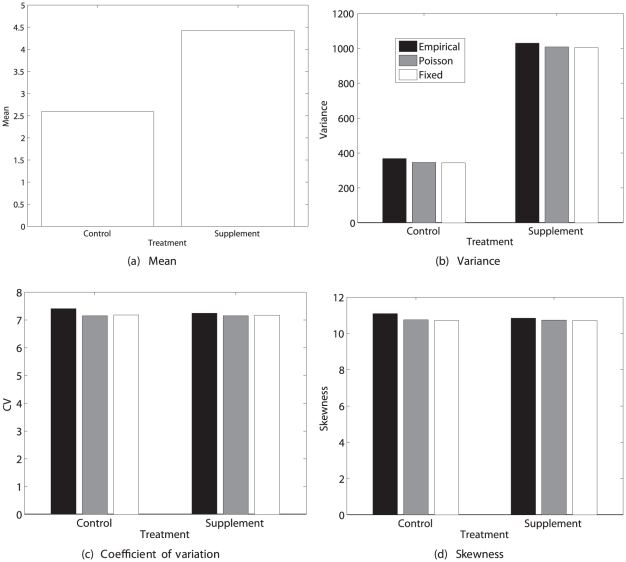
Figure 7. The statistics (mean, variance, coefficient of variation, and skewness) of lifetime reproductive output of the perennial plant Trillium grandiflorum, under control and pollen supplementation treatments.
Results are calculated from the empirical moments of rewards, the Poisson reward model, and the fixed reward model. Data from [59].

