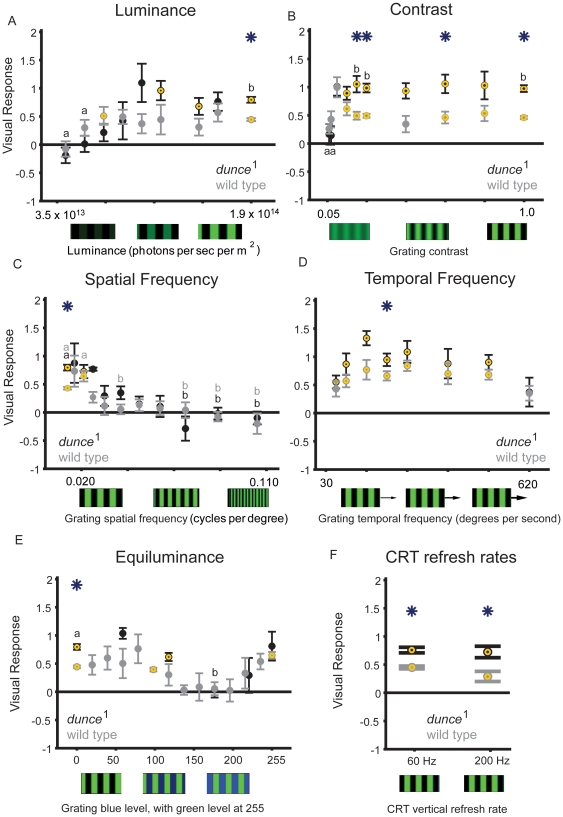
Figure 2. Changing grating parameters.
A. Wild type (gray) and dunce 1 (black) responses to changes in green luminance (all other grating parameters are standard, as described in the Metods). B. Wild type and dunce 1 flies responsivenss to changes in contrast. C. As the spatial frequency increased (velocity maintained constant), dunce 1 and wild-type flies decreased their response to the moving gratings. D. The grating velocity profile is similar between dunce 1 and wild type, with decreased responsiveness for bars moving very fast or very slowly. E. Equiluminance experiments. The luminance of a moving blue grating on a constant green background was gradually increased in different experiments. Visual responsiveness for both dunce 1 and wild type is lost when blue and green are equiluminous (∼175 blue versus 255 green intensity, see Methods). The same experiment was also performed with changing green luminance on a constant blue background, with qualitatively similar results (not shown). F. Screen refresh rates. We exposed dunce 1 and wild-type flies to the standard green/black moving grating (as in Figure 1) at different refresh rates for the CRT computer monitor (see Methods). Above the presumed flicker fusion frequency for fly vision (∼200 Hz [5]), visual responses were not different than for our standard 60 Hz refresh, with dunce 1 respondes significantly greater than wild type to gratings refreshed at 200 Hz as well as 60 Hz. For all of these experiments (A–F), yellow circles identify significant responses compared to zero, asterisks identify significant differences between the strains (P<0.01, by t-test), and “a” and “b” identify significantly different groups within a strain (P<0.01, by ANOVA, multiple comparisons test; gray, wild type; black dunce 1).These statistics show similarities between the curves for either strain, also analyzed by correlation statistics in Table 1.

