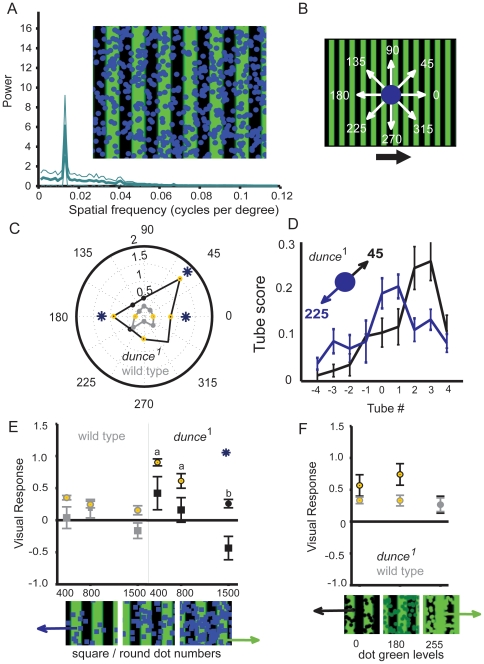
Figure 5. Combining the wide-field stimuli.
A. ∼500 coherent blue dots were layered onto the moving grating (see http://web.qbi.uq.edu.au/vanswinderen/Movie3.mpeg). A power spectrum (± s.e.m.) for the image is shown (see Methods). B. The dot stimulus was moved in eight different directions relative to the grating motion, with 0° representing coherent movement with the grating and 180° movement against the grating; relative grating direction is indicated by the black arrow; the maze is placed over the grating as in Figure 1C. C. Polar plot of visual responses for both strains responding to the combined stimuli for 8 different dot motion directions (gray: wild type; black: dunce 1). *, significantly different between the stains; yellow dot, significantly different from zero, P<0.01. D. Distribution of dunce 1 flies in the maze (proportion in tube ± s.e.m.) for two different superimposed dot orientations (45° and 225°). E. The effect of changing dot shape from circles to squares (moving at 180° against the grating), as indicated by the shape of the points. *, significantly different response between circles or squares, P<0.01. F. Changing dot luminosity. In the two extreme conditions (green = 0 and green = 255), dots are either fully black or green. For all VR data, * = significantly different response between wild type (gray) and dunce 1, P<0.01; yellow circles indicate that the visual responses are significantly different from zero, P<0.01.

