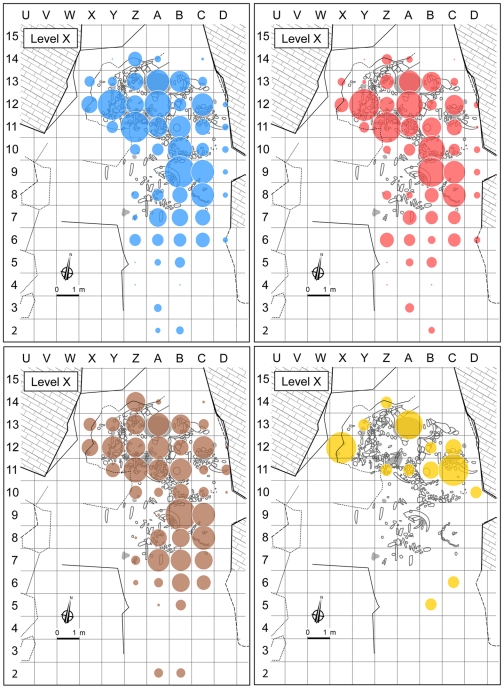
Figure 5. Spatial distribution of colorants by weight in Châtelperronian level X (all sublevels included); data from.
[27] . Top left, all colors (14,580 g); top right, red (10,520 g); bottom left, black (3,961 g); bottom right, yellow (99.6 g). Bubble sizes reflect the relative frequency per grid unit and were calculated by assigning the following values to the four weight classes given in the data source: [0.1–10 g] = 10 g; [10–50 g] = 50 g; [50–100 g]; = 100 g; [>100 g] = 150 g. Major concentrations are apparent despite the smoothing of the distributions caused by the quantification procedure and they coincide with the habitation features. The grey areas are hearths.

