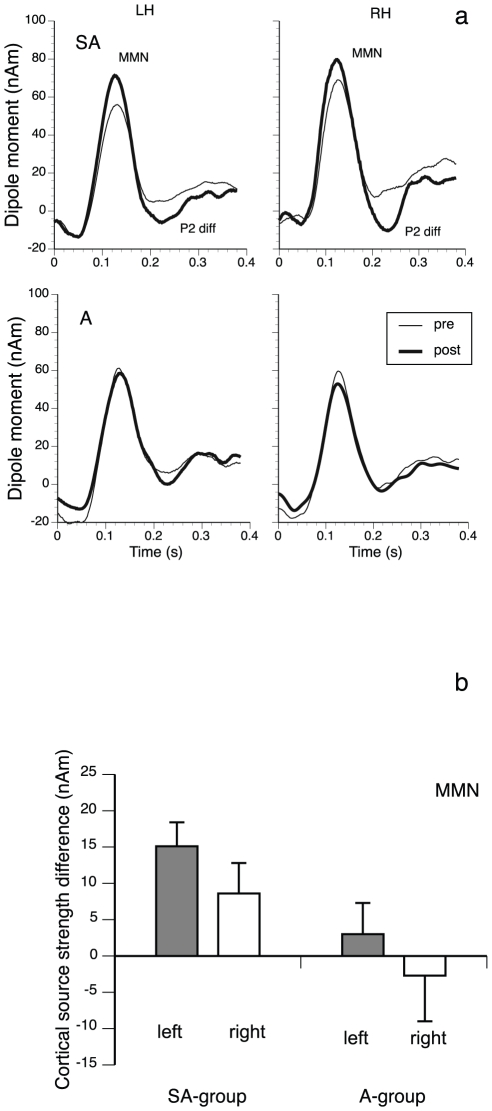
Figure 3. MMN results.
(a) Group averages of the source waveforms obtained after performing source-space projection before and after training for both groups and hemispheres. Data for the SA-group are shown in the upper row, data for the A-group are shown in the bottom row. Data from the left hemisphere (LH) are presented on the left and those of the right hemisphere (RH) are presented on the right. Thin lines indicate pretraining and thick lines posttraining data. (b) Group averages of the pretraining/posttraining differences of the individual MMN source waveform peak amplitudes from both groups and hemispheres. Left: left hemisphere; right: right hemisphere; seq: sequence. Error bars indicate SEM.

