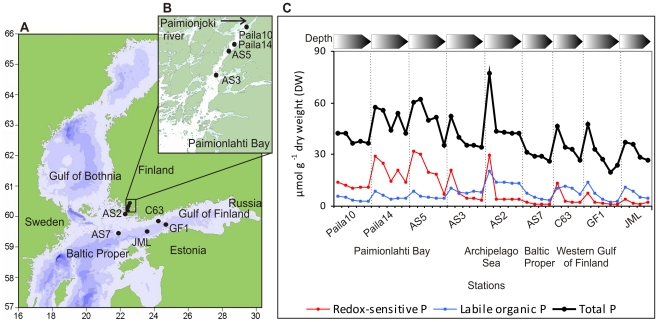
Figure 1. The research area and the sediment sampling stations.
(A) The sampling stations in Paimionlahti Bay (Paila10, Paila14, AS5, and AS3), in the Archipelago Sea (AS2), in the northern Baltic Proper (AS7), and in the western Gulf of Finland (JML, GF1, and C63). (B) A magnification of Paimionlahti Bay and the sampling sites located in the estuary. (C) Concentrations of reactive phosphorus (P) forms; redox-sensitive and labile organic P, and total P in the solid phase of the sediment samples. Arrows (in the upper part of the panel C) indicate sediment depth from 1 cm down to 25 cm below the seafloor (Refer to Dataset S2). Darkening colour of the arrows denotes the increasing subsurface depth.

