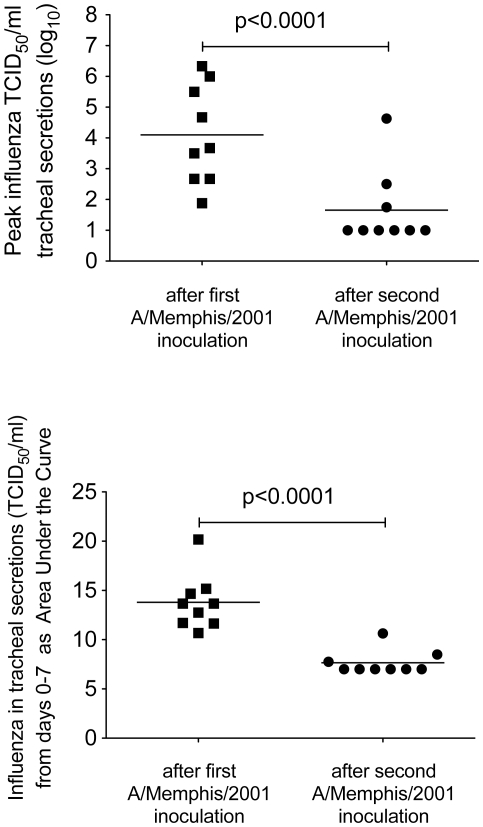
Figure 4. Comparison of influenza virus replication in the lower respiratory tract after the first and second A/Memphis/7/01 inoculations.
(A) Mean peak infectious virus titer in tracheal secretions (TCID50/ml). (B) Mean AUC of the infectious virus titer in tracheal secretions from day 0 to day 7 after re-challenge.

