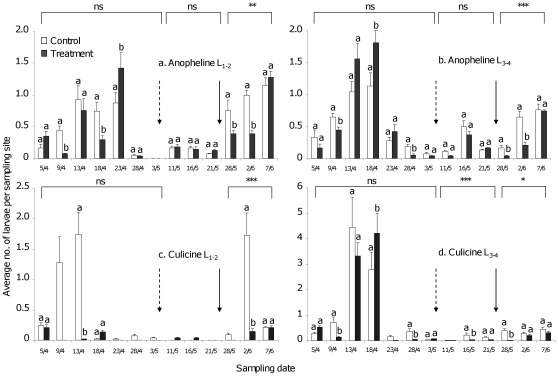
Figure 5. Average number (±S.E.) of early (L1 –2) and late (L3–4) anopheline and culicine larvae per sampling site.
Average (± SE; n = 6) of early stage (L1–2) and late stage (L3–4) anopheline and culicine larvae per sampling point. The broken arrow indicates the first Aquatain application (1 ml/m2). The solid arrow represents the second Aquatain application (2 ml/m2). The square brackets on the top represent the overall comparison of the control and treated paddies before application (pre-application, 5/4–3/5) and after first (11/5–21/5) and second application (28/5–7/6). n.s., non-significant; *, p<0.05; **, p<0.01; ***, p<0.001 (Generalized estimating equations). Similar small case letters on every bar represent no significant difference (t-test, p<0.05) in the control and treatment paddies on that sampling date.

