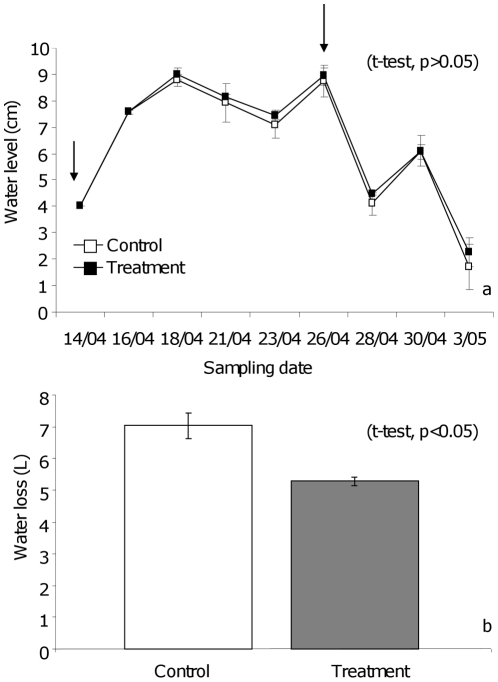
Figure 7. Water level and volume as a measure of water loss due to evaporation.
a: The water level (cm) in the control and treated tubs (with rice plants and soil) on each sampling date. Arrows represent Aquatain application (1 ml/m2). b: The volume of water lost (Liters) from the control and treatment tubs in the assays (without rice plants and soil).

