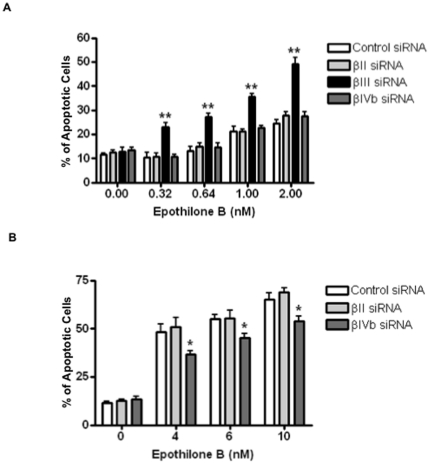
Figure 4. Annexin V staining of siRNA-transfected H460 cells following 48 h incubation with epothilone B.
Open bars: control siRNA-transfected cells; light grey solid bars: βII-tubulin knockdown cells; solid black bars: βIII-tubulin knockdown cells; dark grey solid bars: βIVb-tubulin knockdown cells. Note epothilone B was able to induce apoptosis in the βIII-tubulin knockodown cells at concentrations as low as 0.32 pM (A), whereas higher concentrations of epothilone B induce significantly lower apoptosis in the βIVb-tubulin knockdown cells (B). Data represent means ± SEM of at least three independent experiments. *P<0.05; **P<0.01.

