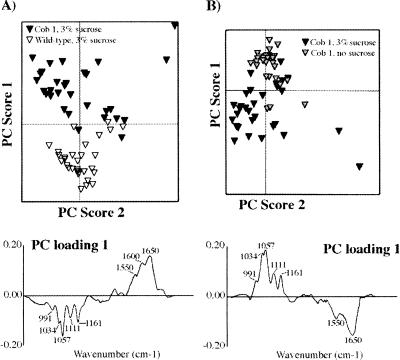
Figure 2.
FTIR analysis of cell walls prepared from wild-type and cob1 roots grown in the presence or absence of sucrose. Exploratory PCA (see Materials and Methods) was performed using 30 FTIR spectra from each population. (A) PC1 clearly discriminates wild-type spectra from cob1 spectra when the plants have been grown in the presence of 3% sucrose. Axes represent the mean values for the population. The corresponding loading (below) has features characteristic of cellulose and protein (peaks of interest are marked). Cellulose peaks are negatively correlated, indicating that cob1 is cellulose-deficient relative to wild type. (B) PC1 discriminates between spectra obtained from cob1 roots grown in the presence or absence of sucrose. The corresponding loading also has features of cellulose and protein (peaks of interest are marked). Cellulose peaks are positively correlated indicating that cob1 grown in the presence of sucrose is cellulose-deficient relative to cob1 grown in the absence of sucrose.

