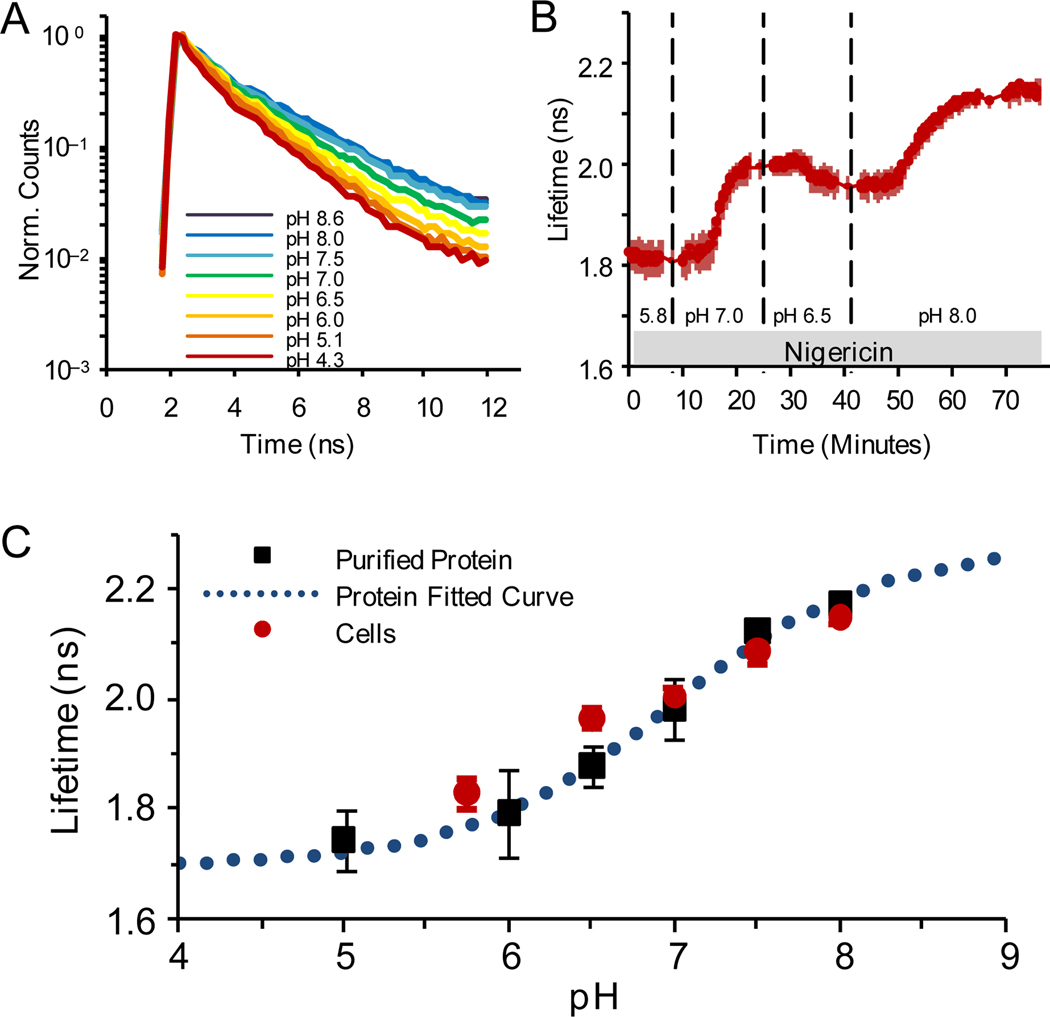
Figure 2.
pH response of pHRed fluorescence lifetime (630 nm emission) with 860 nm two-photon excitation. (A) pH response of peak normalized fluorescence lifetime decays of purified pHRed in solution. (B) Intracellular pH in live Neuro2A cells imaged with FLIM. The nigericin method was used to manipulate pH. (C) pH response of pHRed fluorescence lifetime in cells (n=6) and protein in solution (n=3) in solution agreed well with an apparent pKa of 6.9 ± 0.2, similar to the F575/F440 intensity ratio response.

