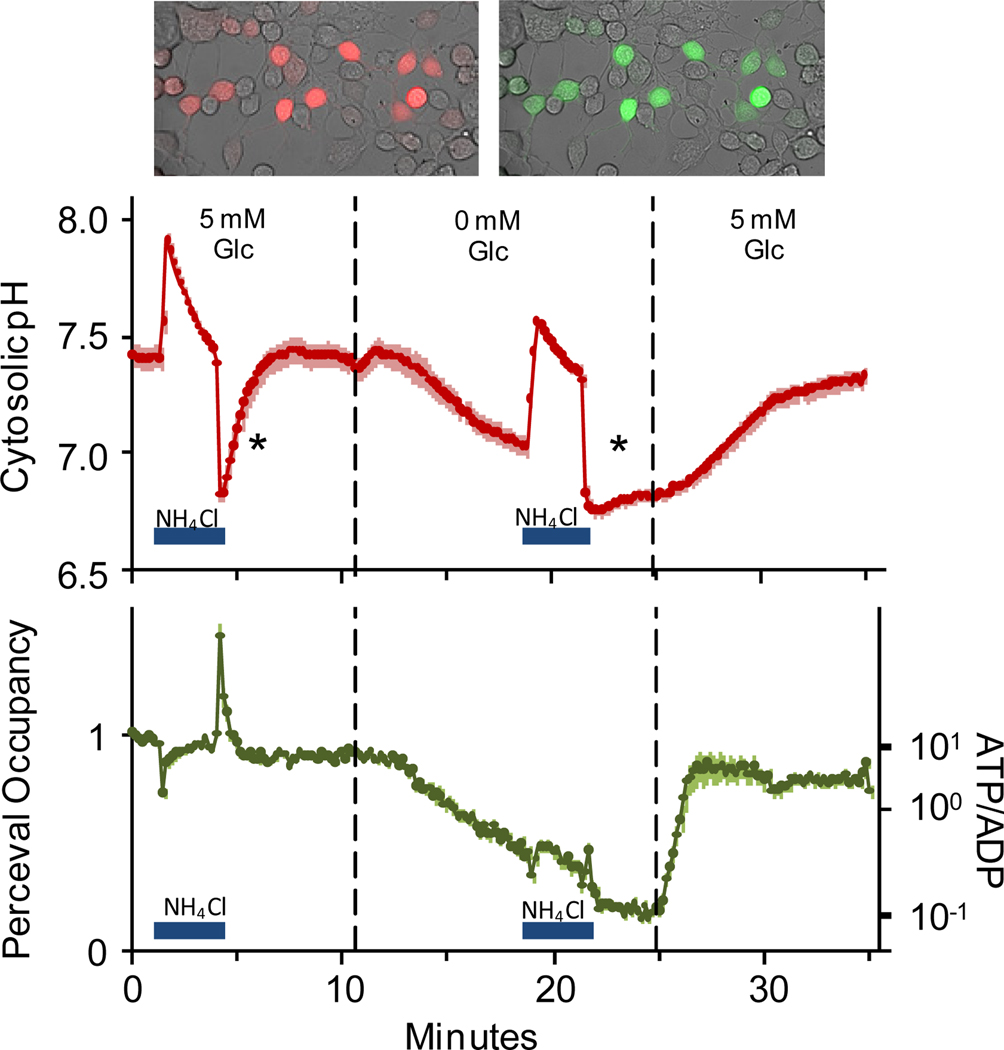
Figure 4.
Co-expression of pHRed and Perceval for simultaneous imaging of the intracellular pH and the ATP/ADP ratio in live Neuro2A cells. Top: pHRed 629 nm (left) and Perceval 525 nm (right) emission in the same cells. Middle: In high glucose, cells rested at pH 7.4 and showed rapid recovery from an acid load induced by a 10 mM NH4Cl prepulse (first asterisk). Complete glucose withdrawal caused acidification, and recovery from an acid load was attenuated (second asterisk). Bottom: Glucose withdrawal caused a decrease in ATP that was promptly reversed with re-feeding. The Perceval signal was pH corrected using pHRed. Small errors in the correction remain at the start and end of the NH4Cl pulses. n=14.

