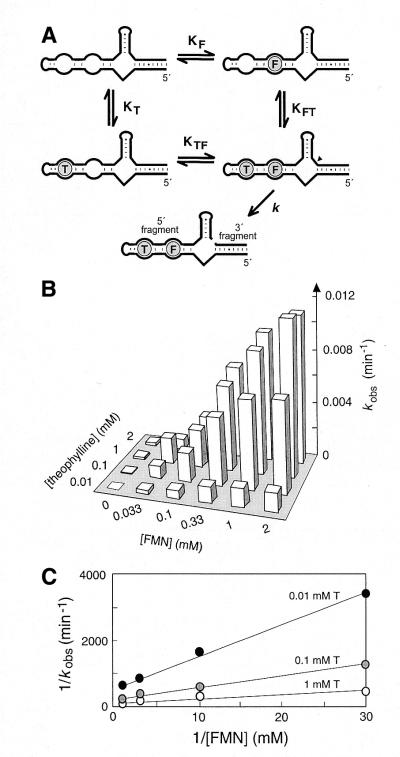
Figure 3.
Kinetic modulation of a binary RNA switch. (A) Diagrammatic representation of the kinetic framework for binary allosteric ribozyme function. Encircled T and F represent bound theophylline and FMN, respectively. (B) Effector-dependent activation of TF1 self-cleavage. The maximum kobs for ribozyme function in 1 mM each of theophylline and FMN is ∼1.2 × 10⁻² min–1. (C) Double reciprocal plots reflecting the dependence of the observed rate constant for TF1 self-cleavage with various concentrations of effectors. Open, shaded and filled symbols represent data collected at 0.01, 0.1 and 1 mM theophylline, respectively.

