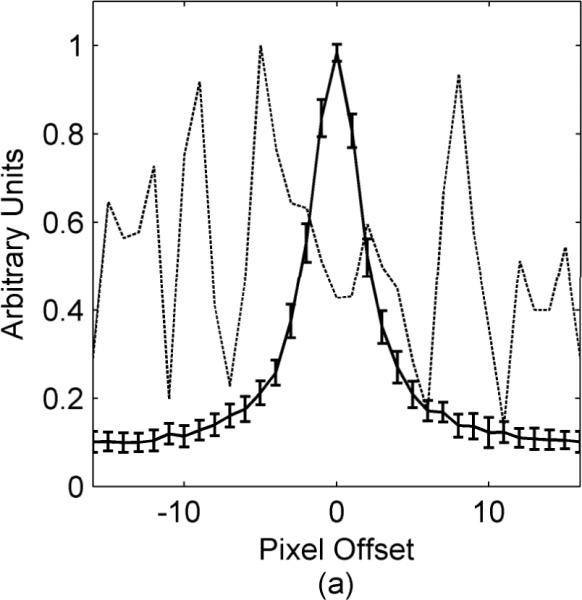
Figure 1.

Error function dispersion for a volunteer who swallowed during an axial 2D TSE neck scan. The solid line shows a plot through the average error function obtained from comparing all sets of adjacent data segments excluding the segment where swallowing occurred. The error bars on the solid line indicate the standard deviation of all these error functions. The dashed line is a plot through the error function when the volunteer swallowed.
