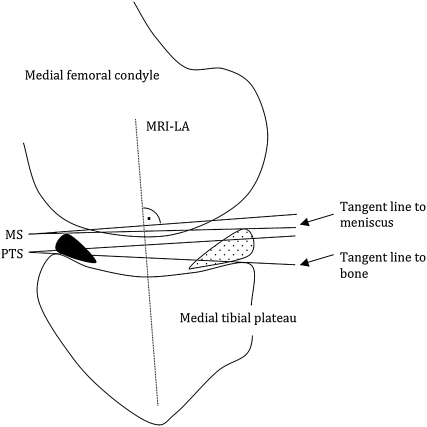
Fig. 1.
A diagram of the scheme for assessment of the PTS and MS on MRI is shown. The image shows the contours of a sagittal MR image at the mediolateral center of the medial plateau. A tangent line is drawn to the most superior anterior and posterior cortex edges of the medial bony plateau. Accordingly, the superior anterior and posterior meniscal borders mark the MS. The same procedure is performed for the lateral plateau. The MRI-LA is defined by the connection of two circles positioned in the proximal tibia as described previously [23].

