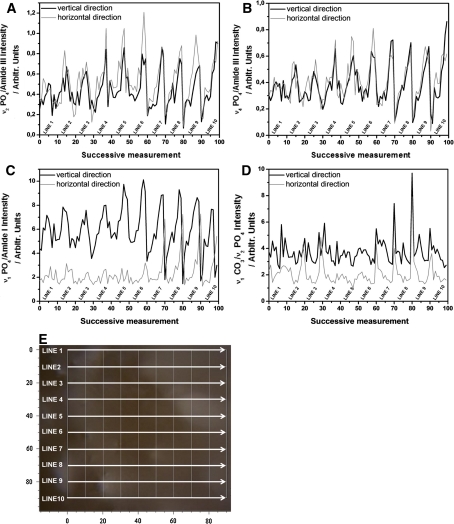
Fig. 2.
Plots of ν2PO4 3−/Amide III (a), ν4PO4 3−/Amide III (b), ν1PO4 3−/Amide I (c) and ν1CO3 2−/ν2PO4 3− (d) ratios obtained from Raman maps of spongy bone tissue with horizontal (thin gray line) and vertical (thick black line) polarization of laser light. The photo (e) with grid of Raman spectra measurements on trabecula surface. The lines show directions of successive measurements

