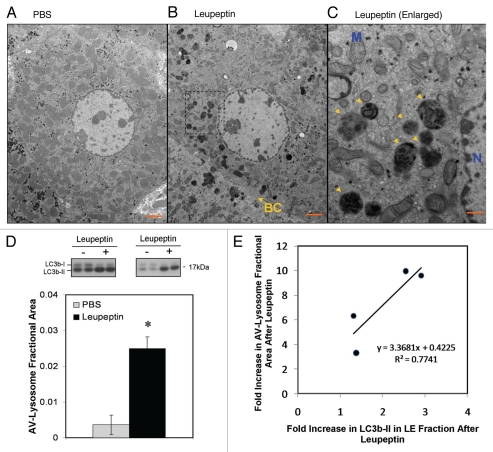
Figure 3.
Ultrastructural changes in autophagosomes and lysosomes induced by leupeptin treatment. (A) Representative electron micrograph at 1,900x of a hepatocyte from a PBS treated animal. Scale bar = 2 µm. (B) Representative micrograph at 1,900x of a hepatocyte 60 min after injection of 40 mg/kg leupeptin. A bile canaliculus (BC) is denoted by a yellow arrow. Scale bar = 2 µm. (C) 5,800x magnification of the framed area in (B) demonstrating engorged lysosomes and late autophagosomes (yellow arrowheads). The nucleus (N) and a representative mitochondria (M) are labeled in blue. Scale bar = 500 nm. (D) Morphometric analysis of autophagosome (AV) and lysosome cross-sectional area in hepatocytes as a fraction of total cytoplasmic area. Filled bar represents the mean ± SD for leupeptin treated livers and the open bar represents the mean ± SD for PBS treated livers (n = 4 animals per treatment pooled from two independent experiments; n = 20 randomly selected hepatocytes per specimen). LC3b western blots for all eight liver specimens that were included in the morphometric analysis are depicted above the bar graph. *p = 0.01, Students 2-tailed t-test. (E) Scatter plot depicting the induction of AV-lysosome area versus the induction in LC3b-II content in the LE fraction of the four leupeptin-treated livers depicted in (D). A linear regression line is also depicted.

