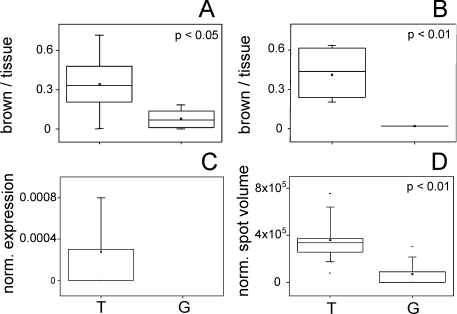
Figure 4.
Box and whisker plots for expression data of nucleoside diphosphate kinase A (P15531). A. Expression amount on proprietary immunohistochemically stained tissue slices (anti nm23) represented by the proportion of brown pixels per tissue pixels. Replicates: n = 9 for T, n = 9 for G. B. Expression amount on immunohistochemically stained (HPA008467) tissue slices from the Human Protein Atlas represented by the proportion of brown pixels per tissue pixels. Replicates: n = 6 for T, n = 2 for G. C. Normalized protein expression amounts using quantitative label-free LC-MS data. Replicates: n = 9 for T, protein not found in G. D. Normalized protein expression amounts using densitometric data (normalized spot volumes) from 2-D gels. Replicates: n = 12 for T, n = 12 for G. Tumor samples (T) are depicted on the left and control (gland) samples (G) on the right, p-values are given.

