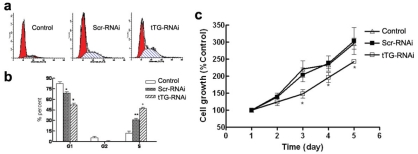
Figure 3.
Analyses for cell proliferation and apoptosis of activated HSC after infected with tTG-RNAi-Lentivirus. (a and b) Cell cycle assay by flow cytometry, *, P<0.01 and **, P<0.01 vs CON; #, P<0.01 and +, P<0.01 vs CON and GFP. (c) Cell growth curve by MTT. +, P<0.01 vs CON; #, P<0.01 vs CON and GFP;*, P<0.01 vs CON and GFP.

