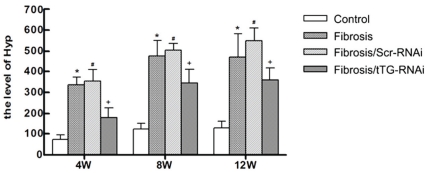
Figure 5.
The level of hydroxyproline after tTG-RNAi-Lentivirus transfer in fibrosis rat liver. C, F, G and T, represents the group of normal control, liver fibrosis, fibrosis rats treated with GFP-RNAi-Lentivirus and the tTG-RNAi-Lentivirus, respectively. *, P<0.01 and #, P<0.01, contrasted to C group; +, P<0.05, contrasted to F and G group.

