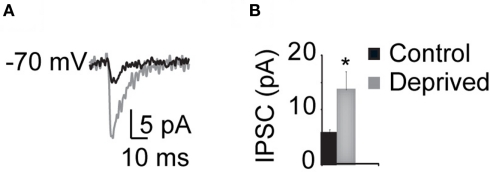
Figure 8.
MD increases the GABAA synaptic component measured intracellularly. (A) Sample evoked IPSCs recorded in voltage clamp in response to extracellular stimulation in L4. Black: Control; gray: Deprived. (B) Cumulative bar plot of the average IPSC amplitude. Black: Control; gray: Deprived. Asterisk indicates significant changes.

