Figure 1.
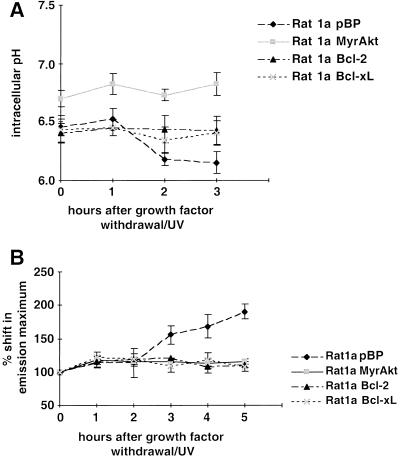
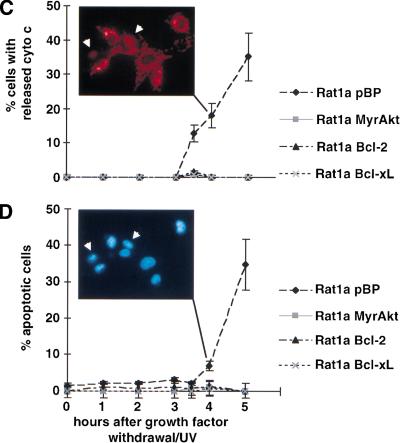
Sequence of events in growth factor withdrawal/ultraviolet-induced apoptosis. Apoptosis was induced in Rat1a pBP (vector control), Rat1a/MyrAkt, Rat1a/Bcl-2, and Rat1a/Bcl-xL cells by serum starvation and ultraviolet irradiation (50 J/m2). At the time points indicated, intracellular pH (pHi), mitochondrial dye uptake, cytochrome c release, and chromatin condensation were determined. All data represent the average (±SE) of at least three independent experiments. (A) Fluorescence-activated cell sorter (FACS) analysis of pHi with SNARF1-acetate (Molecular Probes), a fluorescent dye that shows a pH-dependent shift in its emission maximum. Time course of pHi after induction of apoptosis (P < 0.05 vs. untreated control). (B) FACS analysis of mitochondrial dye uptake. Cells were loaded with DiOC6 (or MitoTracker CMXRos) and subjected to FACS analysis. The results were normalized to the dye uptake at 0 h. The increase in mitochondrial dye uptake reflects a hyperpolarization that precedes the loss of mitochondrial membrane potential that is a late event in our system. (C) Analysis of cytochrome c release. The percentage of cells with released cytochrome c was scored by immunofluorescence staining with anticytochrome c antibodies (P < 0.002). The insert shows a typical picture of cytochrome c immunofluorescence 4 h after apoptosis induction. The arrows indicate cells with diffuse cytochrome c staining. (D) Analysis of apoptosis. The percentage of cells with condensed chromatin was determined by DAPI staining (P < 0.002). The insert shows Hoechst staining of the same field as shown in C. The arrows indicate the cells with released cytochrome c, the left one showing condensed chromatin.


