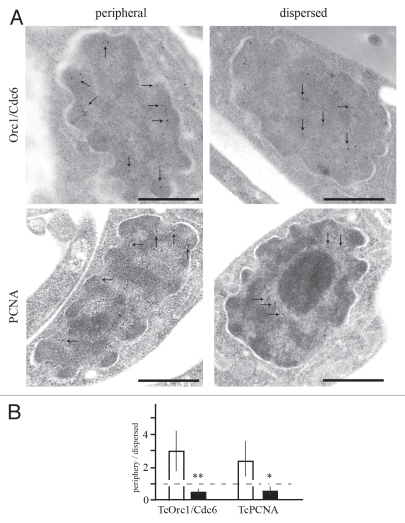
Figure 3.
Ultrastructural immunocytochemistry showing the localization of TcOrc1/Cdc6 and TcPCNA. (A) Exponentially growing epimastigotes were fixed and processed for immune electron microscopy and labeled with anti-TcOrc1/Cdc6 (top parts) or with antiTcPCNA (bottom parts), followed by anti-rabbit IgG conjugated to 10 nm gold particles. Arrows indicate the gold particles seen in each micrograph. Bars = 0.5 µm. (B) Statistical analysis of the patterns observed in (A). First, we defined “close to nuclear periphery” as the region between nuclear membrane and eletrodense chromatin. Then, we analyzed different images and determined the number of gold particles “close to nuclear periphery” or “dispersed through the entire nucleus”. The ratio between “close to nuclear periphery“ and “dispersed through the entire nucleus” was plotted for peripheral pattern (white box) or dispersed pattern (black box). Interrupted line indicates the ratio 1 that means the same number of gold particles close to nuclear periphery and dispersed through the entire nucleus. **p < 0.01 and *p < 0.05.

