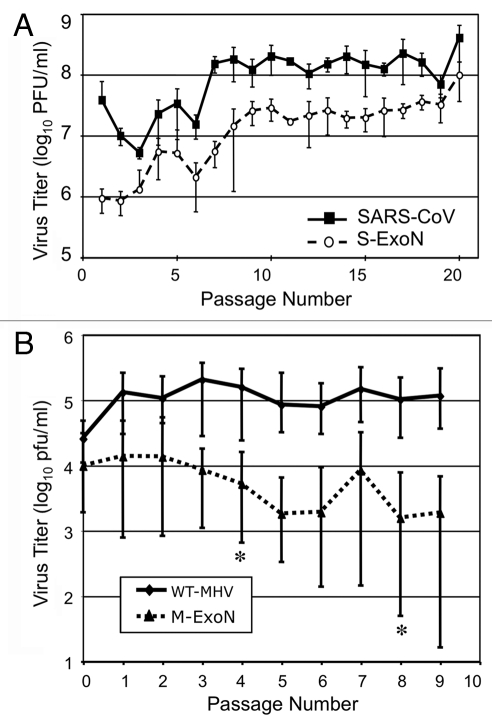
Figure 4.
Population and plaque passage of S-ExoN and M-ExoN. (A) Population passage of WT SARS-CoV and S-ExoN (Adapted from Eckerle, et al.7). (B) Parallel plaque passages of 10 plaques each of WT-MHV and M-ExoN. *indicates passage where loss of a plaque lineage occurred.

