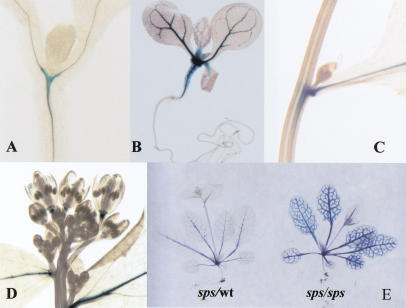
Figure 5.
SPS expression patterns monitored by GUS expression from the Ds gene trap insertion in sps-2. (A–D) GUS staining patterns of heterozygous sps plants. (A) Staining detected at the vascular junction of a 7-d-old seedling. (B) Extensive staining in the vascular tissue of a 10-d-old seedling. (C) Strong SPS expression at the cauline leaf axil. (D) Staining at the receptacle of flowers. (E) GUS staining patterns of heterozygous (left) and homozygous sps (right) plants.

