Figure 3.
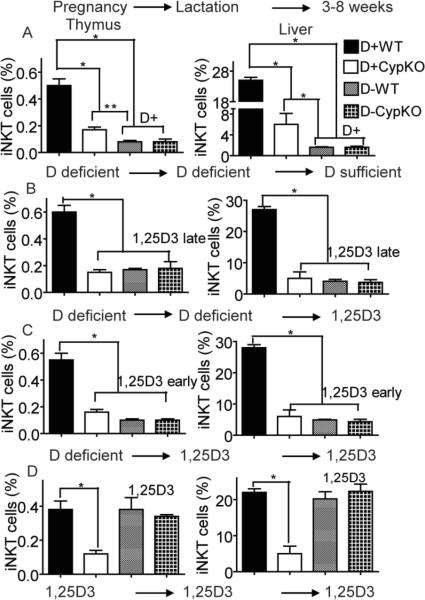
Epigenetic effects of vitamin D deficiency on iNKT cell numbers. (A) Effect of vitamin D intervention on iNKT cell numbers. Cyp ko/+ breeders started on D− diets and littermates were switched to D+ diet at 3wks of age and continued until 8wks (D+). Values are mean ± SEM of n=5 mice per group. (B) Effect of 1,25D3 intervention on iNKT cell numbers. Cyp ko/+ breeders started on D− diets and littermates were switched to 1,25D3 at 3wks of age and continued until 8wks (1,25D3 late). Values are mean ± SEM of n=8 mice per group. (C) Effect of early 1,25D3 intervention on iNKT cell numbers. Cyp ko/+ breeders started on D− diets and intervention with 1,25D3 started just before birth (embryonic d20) and continued until 8wks (1,25D3 early). Values are mean ± SEM of n=12–15 mice per group. (D) Effect of continuous supplementation of 1,25D3 on iNKT cell numbers. Breeders and offspring were fed 1,25D3 throughout (1,25D3). Continuous supplementation of 1,25D3 resulted in normalization (D+ WT numbers) of the iNKT cell numbers in both the WT and Cyp KO mice. Values are mean ± SEM of n=6–8 mice per group. * p<0.001, ** p<0/05.

