
Figure 4.
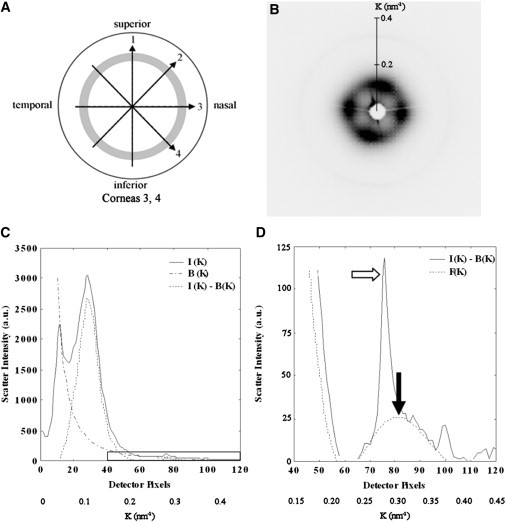
(A) Scan lines on the two right human corneoscleral buttons used for SAXS. The sampling interval was 0.5 mm and the shaded region denotes the limbus. (B) SAXS pattern from the center of Cornea 3. (C) Vertical intensity profile, I(K), through pattern shown in B. The data is folded about the pattern center. A background function, B(K), is subtracted. The collagen interference function peak arising from the short-range lateral order of the stromal fibrils can be clearly seen. The region bounded by the rectangular box is shown expanded in D. (D) A fibril transform function, F(K), is fitted to the background-subtracted data and the peak position (solid arrow) calibrated to determine the average collagen fibril diameter. The sharp third order collagen meridional peak (empty arrow) is visible merged into the equatorial pattern, and may be ignored in fitting the fibril transform.