
Figure 2.
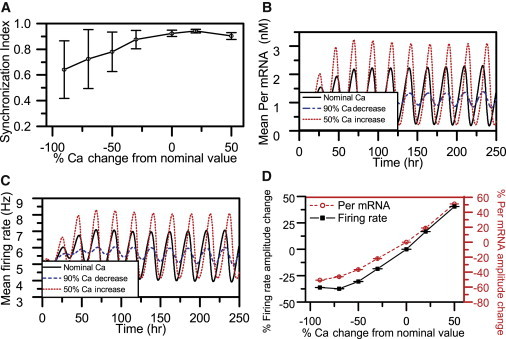
Circadian behavior of the SCN population as a function of intracellular Ca+2 levels. For each calcium concentration, the mean (circle) and SD (error bars) were computed from 10 independent runs. (A) The SI at the 10th cycle versus % changes in cytosolic Ca2+ concentration. Circadian profiles of Per mRNA (B) and neural firing rates (C) averaged over the entire population are shown for nominal calcium concentrations (solid line), 90% decreased intracellular Ca2+ (dashed line), and 50% increased cytosolic Ca2+ (dotted line) compared with the nominal. (D) Average Per mRNA (dashed line) and firing-rate (solid line) amplitudes as a function of the cytosolic calcium concentration.